
The Mortgage Economic Review is a monthly summary of Key Economic Indicators, Data, and Events pertinent to Mortgage, Housing, and Finance Professionals.
A significant amount of the Economic Data used for this report comes from Government Agencies, especially the Bureau of Labor Statistics (BLS), the Bureau of Economic Analysis (BEA), and the Census Bureau. Due to the Government Shutdown, these agencies did not publish data in October. Consequently, some of the data will be absent from this month’s Economic Review.
AT A GLANCE – Key Economic Events and Data released during October 2025
- Interest Rates: The 10-year Treasury yield fell to 4.11% (Oct 31) from 4.15% (Sep 30).
- Housing: Existing Home Sales rose 1.5% (+4.1% YoY), New Home Sales data was delayed, and Home Prices are up about 2.0% YoY.
- Labor: Data from the Bureau of Labor Statistics was delayed.
- Inflation: CPI rose 0.3% in September (+3.0% YoY), and PCE data was delayed.
- The Economy: US GDP grew at a 3.9% annualized rate in 3Q2025 (according to GDPNOW).
- Consumers: Retail Sales data was delayed, and Consumer Confidence fell slightly in October (-13.7% YoY).
- Stock Markets rose in October: Dow +2.4%, S&P +2.3%, Nasdaq +4.7%.
- Oil Prices fell to $61/Barrel (Oct 31) from $62/Barrel(Sep 30).
Interest Rates and Fed Watch
The October FOMC Meeting ended with the Fed cutting the Fed Funds Rate 0.25% to a target range of 3.75% – 4.0%. This was no surprise because expectations were for Interest Rates to be cut in October and December. However, during the press conference after the FOMC Meeting, Chairman Powell said: “a further reduction in the policy rate at the December meeting is not a foregone conclusion.” That comment sent a signal to financial markets that the Fed may not lower rates in December as previously forecast.
Fedspeak Translation: Inflation is still a problem, so don’t expect additional cuts until Inflation softens.
The next FOMC Meeting is December 9th and 10th. At this point, another rate cut is up for grabs, as some members of the committee are divided on the path forward. The Financial Markets are getting concerned that the Fed is having trouble containing Inflation. Despite the concern over future rate cuts, Interest Rates were generally lower during October.![]()
- 10-Year T-Note Yield fell to 4.11% (Oct 31) from 4.15% (Sep 30).
- 30-Year T-Bond Yield fell to 4.67% (Oct 31) from 4.73% (Sep 30).
- 30-Year Mortgage fell to 6.17% (Oct 27) from 6.30% (Sep 25).
- 15-Year Mortgage fell to 5.41% (Oct 27) from 5.49% (Sep 25).
Housing Market Data Released during October 2025
Existing Home Sales rose 1.5% in September, up 4.1% in the last 12 months. Home prices rose slightly in August and are up about 2.0% over the last 12 months. Inventory continues to grow, and Homes are on the market for an average of 33 days. Mortgage rates drifted lower during September. Hopefully, we will get data on the New Home market in November.
- Existing Home Sales (closed deals in September) rose 1.5% to an annual rate of 4,060,000 homes (3,690,000 SFR + 370,000 Condos), up 4.1% in the last 12 months. The median Single Family Home price is $420,700, up 2.3% YoY. The Median Condo price is $370,000, up 0.6% YoY. Homes were on the market for an average of 33 days. Currently, 1,550,000 homes are for sale, up 14.0% YoY.
- Pending Home Sales Index (signed contracts in September) was unchanged from August, down 0.9% YoY.
- S&P/Case-Shiller 20 City Home Price Index rose 0.2% in August, up 1.6% YoY.
- FHFA Home Price Index rose 0.4% in August, up 2.3% YoY.
- The NAHB Index rose 15.6% to 37 in October from 32 in September and August, down 14.0% YoY.
- New Home Sales (signed contracts in September) Delayed
- Building Permits (issued in September) Delayed
- Housing Starts (excavation began in September) Delayed
- Housing Completions (completed in September) Delayed
Labor Market Economic Data Released during October 2025
The Employment Situation Report (Jobs Report) is published by the Bureau of Labor Statistics (BLS) and is released on the first Friday of every month. The “Jobs Report” is a large report with extensive data. It is one of the most examined Economic Reports and a major market mover. Without that report, Labor Market conditions are hard to assess. Labor Market conditions right now are murky with mixed signals. Economists are worried that it could deteriorate rapidly. That fear was heightened when several large corporations announced a rash of upcoming layoffs. Despite the layoff news in October, the most recent available data shows the US Labor Market remains robust. Wage Gains are outpacing Inflation, Unemployment is low at 4.3%, and there are over 7,000,000 job openings.
- Job Creation Data Delayed
- The Unemployment Rate Delayed
- The Labor Force Participation Rate Delayed
- The Average Hourly Wage Delayed
- Job Openings rose to 7,227,000 in August from 7,181,000 in July and 7,357,000 in June, down 5.5% YoY. (In 2024 average Job Openings was 7,800,000).
Inflation Economic Data Released during October 2025
The BLS was able to publish CPI data this month despite the Government shutdown, but we didn’t get PPI or PCE Data. The CPI rose 0.3% in September and 3.0% in the Last 12 months. This data shows that Inflation remains stubbornly high and inching higher. Why? There are several theories. In basic terms, prices are up because demand is up. The Economy is growing at over 3.0% and the Labor Market remains healthy, so Consumers continue to spend. Inflation won’t come down until Consumers rein in their spending. That won’t happen until the Labor Market softens and Consumers worry about their jobs.
- CPI rose 0.3%, up 3.0% YoY | Core CPI rose 0.2%, up 3.0% YoY
- PPI Delayed | Core PPI Delayed
- PCE Delayed | Core PCE Delayed
GDP Economic Data Released during October 2025
The first estimate of 3rd Quarter GDP from the Bureau of Economic Analysis (BEA) will be delayed. In lieu of the BEA data, we can use GDPNOW, which is issued by the Federal Reserve Bank of Atlanta. The GDPNOW Data is calculated using methods similar to those used by the BEA. However, it is presented as a rolling measurement, whereas the BEA data is for a fixed period. According to the latest GPDNOW model, the US Economy is growing at a 3.9% Annual Rate (Seasonally Adjusted). The 3.9% GDP growth eclipses last months 3.8% from the BEA. That’s good news for the Economy, but it makes efforts to reduce Inflation more difficult.
Consumer Economic Data Released during October 2025
Black Friday and the holiday shopping season are just around the corner. Forecasts for Consumer Spending during this critical time are for a 3.5% increase over last year. This is in dollar terms, so it’s keeping pace with Inflation. Consumer Spending has remained consistent despite lower Consumer Confidence, a softening but healthy Labor Market, and a tumultuous political environment.
- Consumer Confidence Index fell 1.0% to 94.6 in October from a revised 95.6 in September, down 13.7% YoY.
- Retail Sales Delayed
- Personal Income Delayed
- Personal Spending Delayed
- Personal Savings Rate Delayed
Energy, International, and Things You May Have Missed
- West Texas Intermediate Crude fell to $61/Barrel (Oct 31) from $62/Barrel (Sep 30).
- North Sea Brent Crude fell to $65/Barrel (Oct 31) from $67/Barrel (Sep 30).
- Gasoline (Wholesale Futures) fell to $1.97/Gal (Oct 31) from $1.98/Gal (Sep 30).
- Natural Gas rose to $4.12/MMBtu (Oct 31) from $3.33/MMBtu (Sep 30).
- The US Federal Government shut down on October 1 due to the inability of Congress to pass a revised budget.
- A meeting between President Trump and Chinese President Xi in South Korea eased tensions between the two countries. They came to agreement on several key issues, including tariffs and exports.
- President Milei won a landslide victory for his La Libertad Avanza party in Argentina. President Trump offered $40B in Economic Assistance contingent on his victory.
The Mortgage Economic Review is a concise summary of Key Economic Data that influences the Mortgage and Housing Markets. It’s a quick read that keeps busy Professionals updated on important Economic Information. Feel free to share this with colleagues in the Mortgage, Housing, Finance, and Banking business. To have the Mortgage Economic Review emailed to you each month, click here.
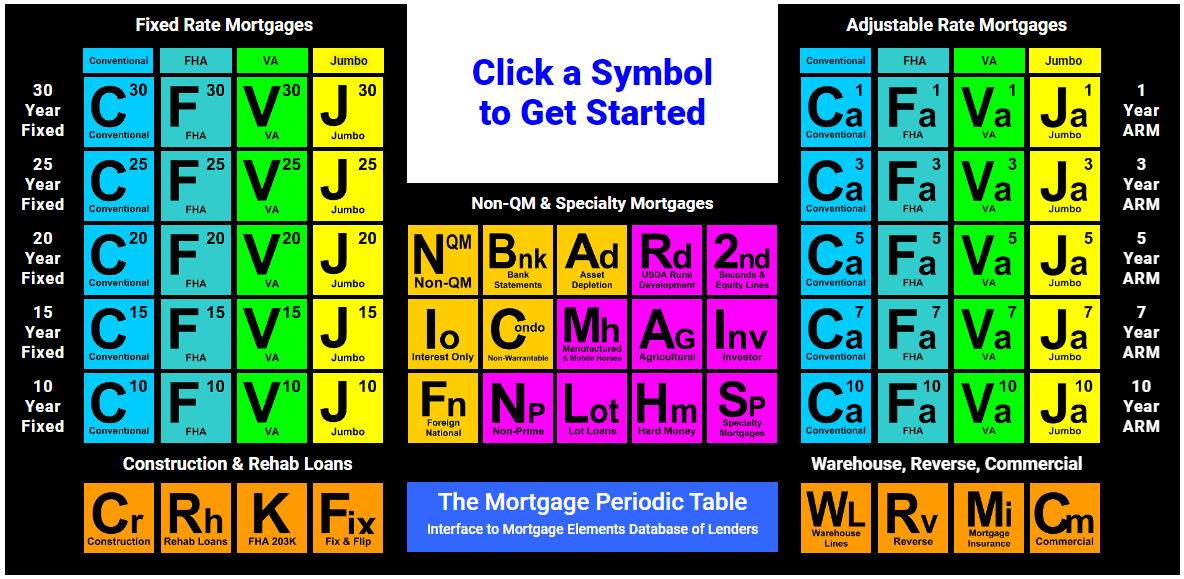
Discover New Lending Opportunities at MortgageElements.com, where you can explore over 300 TPO Wholesale and Correspondent Mortgage Lenders from one website, including:
- Non-QM, Non-Prime, & Hard Money
- Agency: Conventional, FHA, VA, & USDA
- 2nd & Equity Lines
- Reverse
- Commercial
- Warehouse
- Construction, Rehab, 203K, Fix n Flip
Use the Mortgage Periodic Table to research Mortgage Products and connect with TPO Account Executives. It costs nothing to use. It is one of the industry’s largest databases of TPO Mortgage Lenders.
Mark Paoletti, MortgageElements.com
This Economic Review is for informational and educational purposes only and should not be construed as investment, legal, financial, or mortgage advice. The information is gathered from sources believed to be credible and may be opinion-based and editorial in nature. Mortgage Elements Inc does not guarantee or warrant its accuracy or completeness, and there is no guarantee it is without errors. This newsletter is primarily intended for use by Housing and Finance Professionals but it can be useful for anyone interested in Economics. This newsletter is not an advertisement to extend credit or solicit mortgage originations. © Copyright 2025 Mark Paoletti, Mortgage Elements Inc, All Rights Reserved.